Dashboard Overview
Overview
This feature is available from Tower v.22.3.
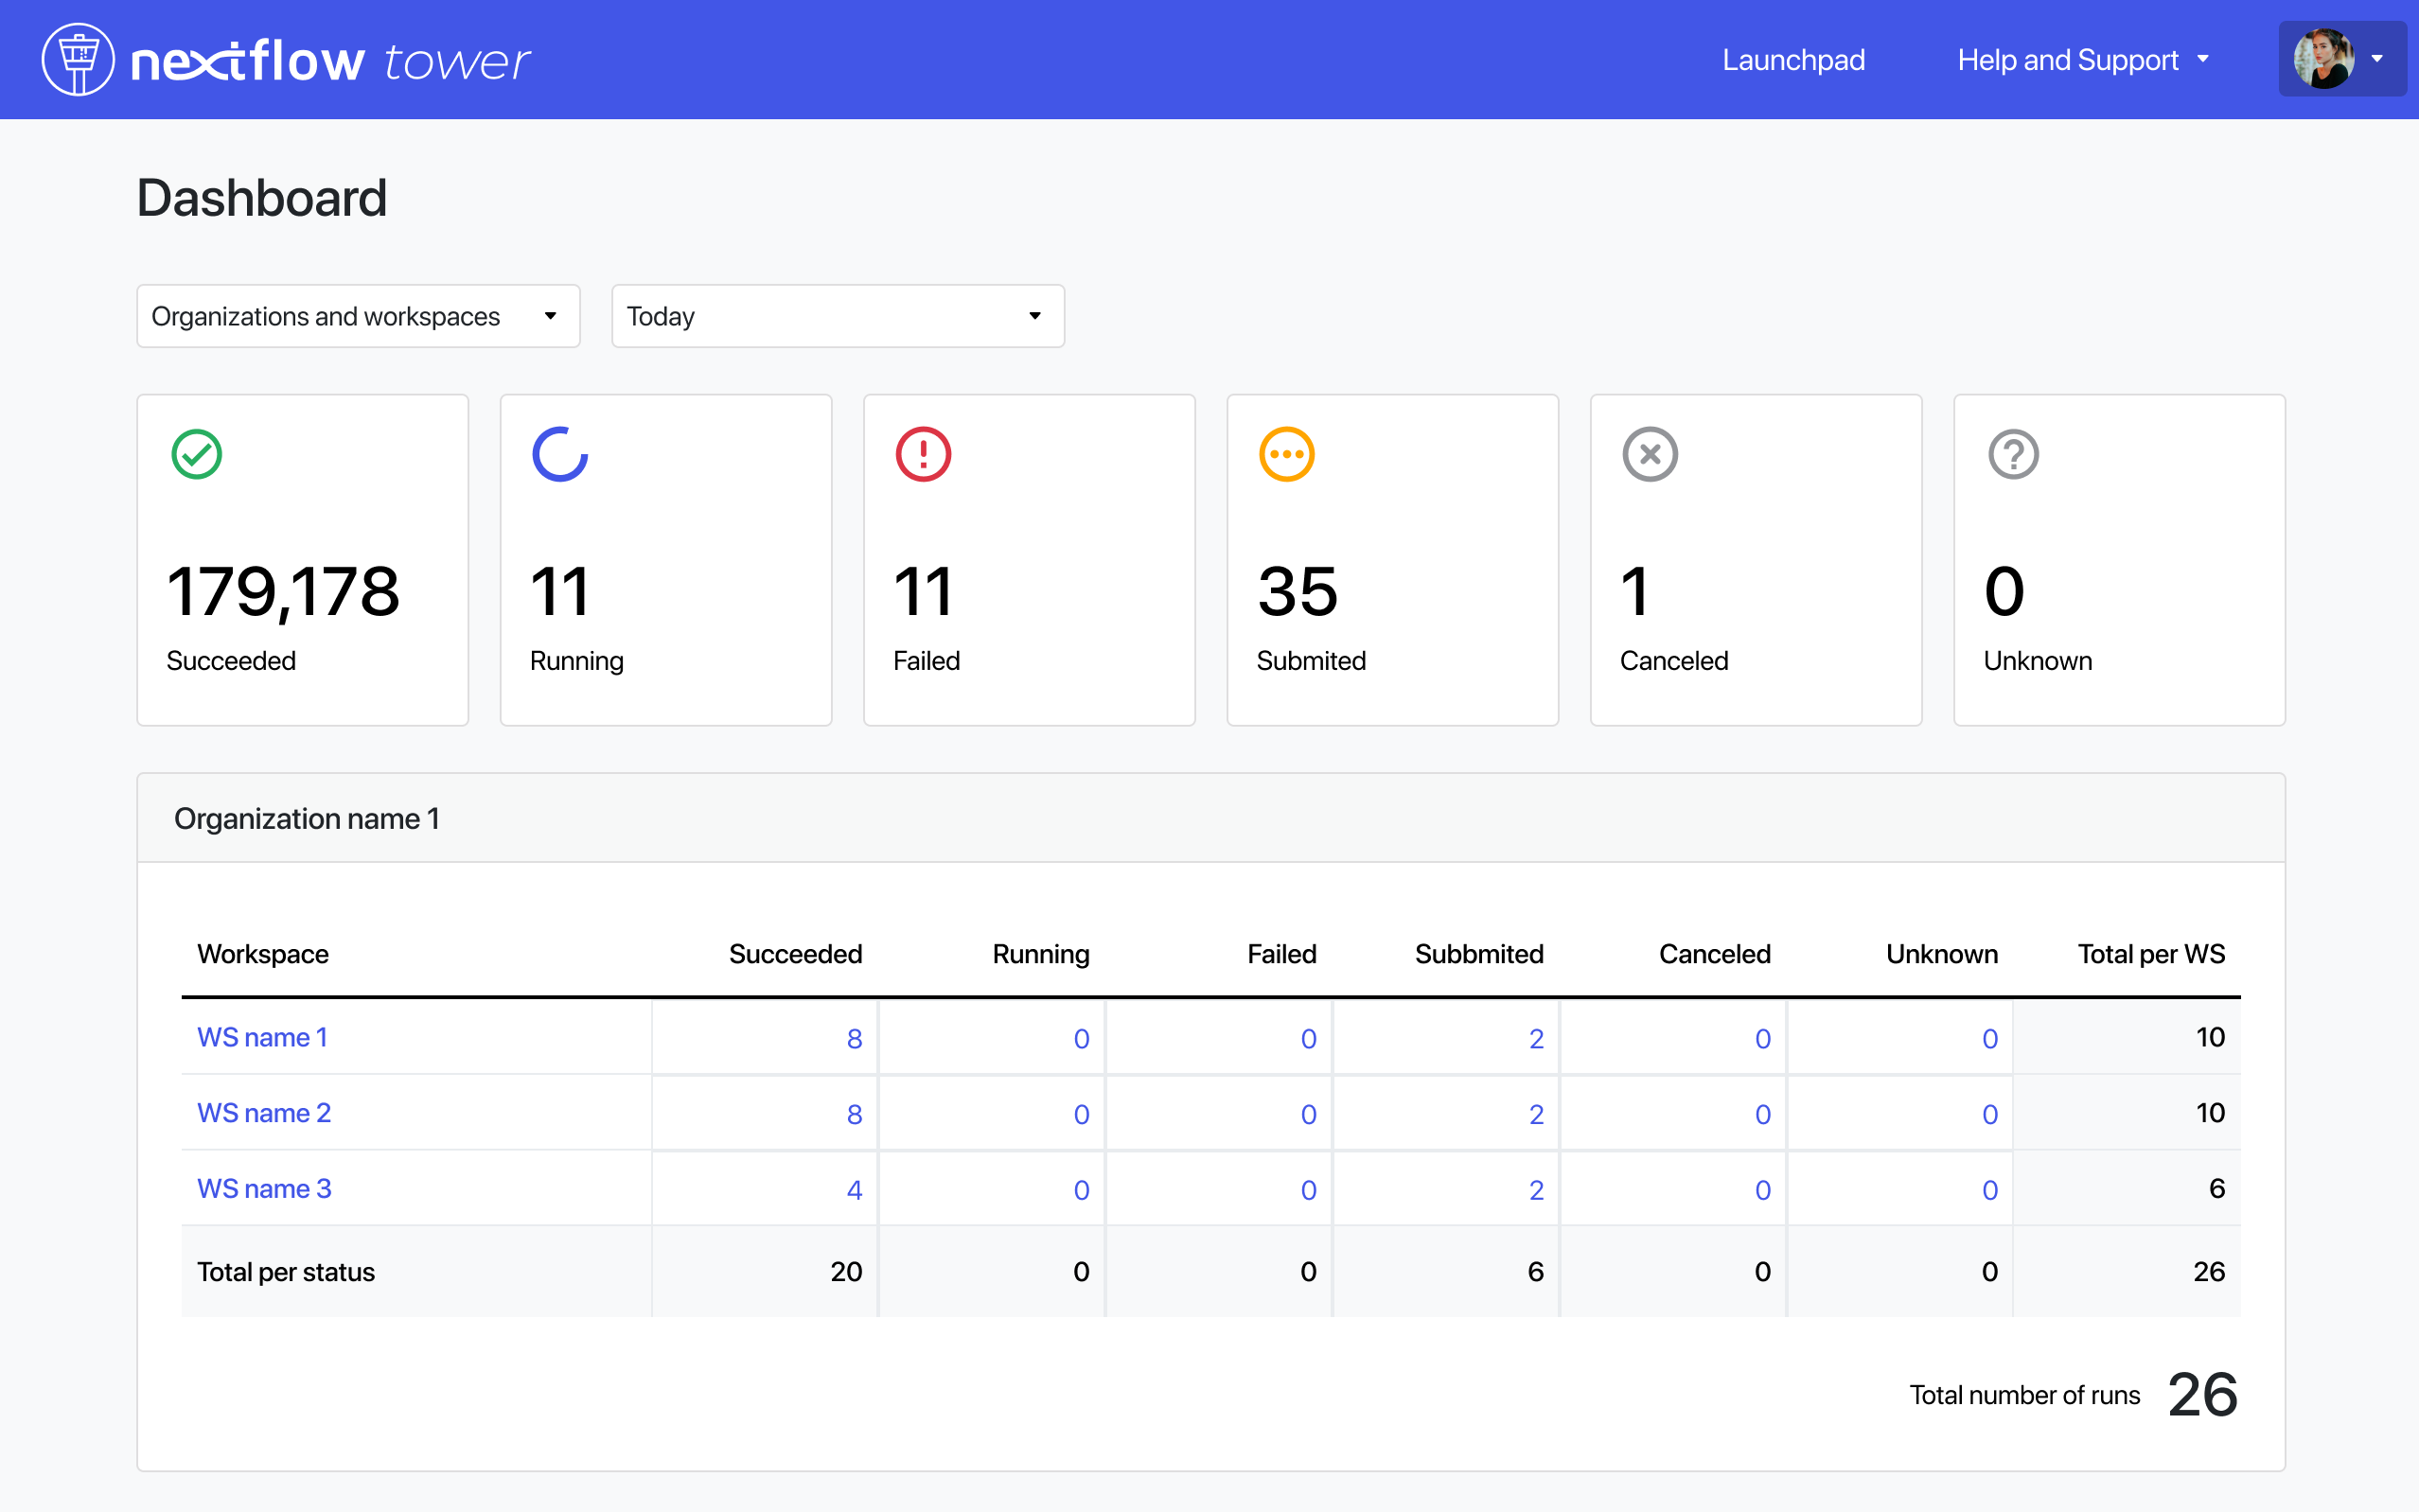
From version 22.3, Tower contains a Dashboard page that provides an overview of runs in your organizations and personal workspace at a glance. The dashboard is accessed from the user menu in the top right corner. Click your avatar, then select "Dashboard".

The page is split into two main areas:
Filters and summary
The drop-down lists at the top of the dashboard page filter total runs by your personal workspace, the organizations you have access to, and time range.
Below the filters, a summary of total runs is shown by status.
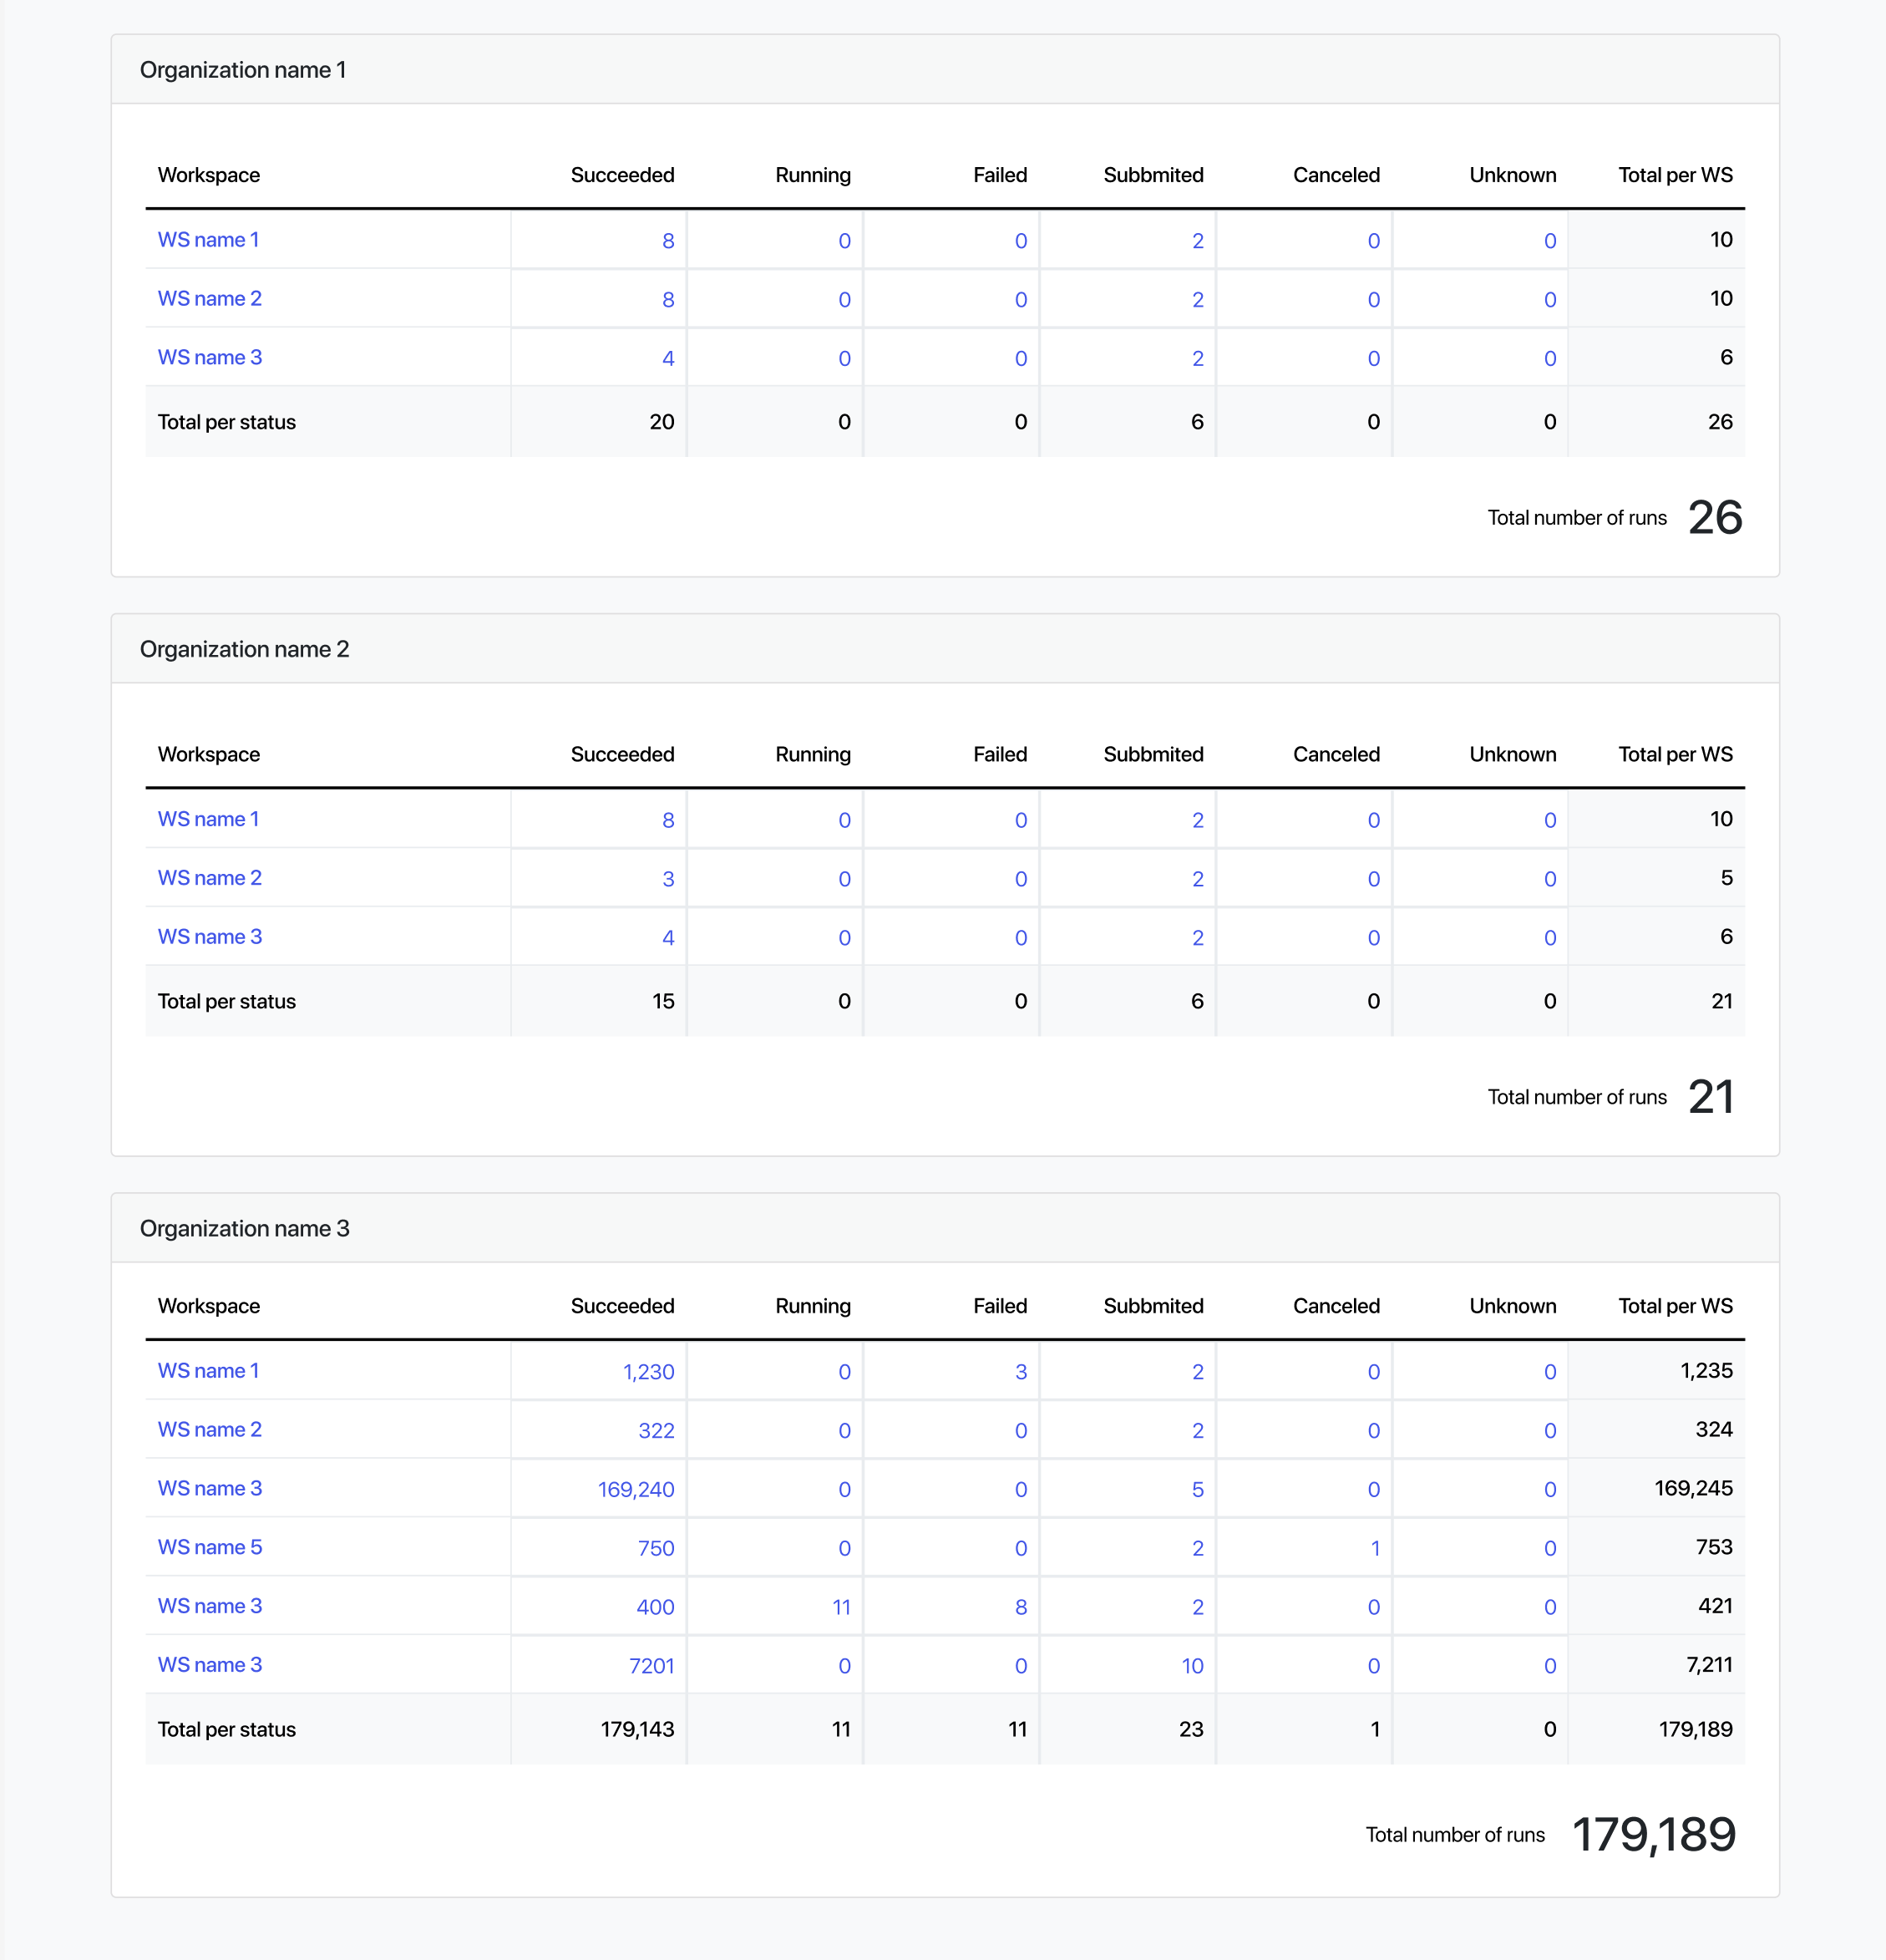
Runs per organization
Below the cards displaying total runs by status, run totals are filtered by each organization or your personal workspace. Filtering depends on what you selected in the drop-down options near the top of the page.
Each card represents an organization. Total runs for the organization are arranged by workspace and status.

Click a run value in the table to navigate to a run list filtered by the status selected.
Click a workspace name in the table to navigate to a run list filtered by the workspace selected.